Question 1:
The dataset contains the collection that appeared on the Reuters newswire in 1987. The documents were assembled and indexed with categories by personnel from Reuters Ltd.
Formatting of the documents and production of associated data files was done in 1990 by Devid D. Lewis and Stephen Harding at the Information Retrieval Laboratory. The articles are related to category Money and crude which are target classes

Problem statements:
Load the dataset from the location of the file provided in “input Format” using pandas
Convert the article_text into word tokens for word classes (money, crude) individually
Find total number of unique tokens for money
Find total number of unique tokens of crude
Convert the article_text into word tokens for both target classes
Remove stop words and punctuations(use reuters_stopwords provided in stub)
Lemmatize and compute the size of the vocabulary
Transform article_text into TF-IDF vector using following parameters:

Find the size of TF-IDF vector and save as (x,y)
Save the findings in a file named output.csv at the location/code/output/output.csv
Hint: While converting articles into tokens join them using single whitespace
Input format:
Read data from a file named Reuters.csv at the location/data/training/Reuters.csv
Output Format:
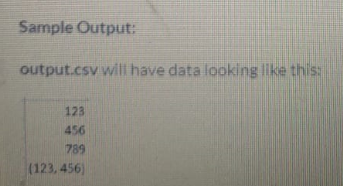
The output file output.csv should contain the findings in the following order:
The 1st row contains the total number of unique tokens for money.
The 2nd row contains the total number of unique tokens for crude
The 3rd row contains the size of vocabulary after lemmatization
The 4rth row contains the size of TF-IDF vector in a tuple format i.e. (x,y)
Question 2:
Description
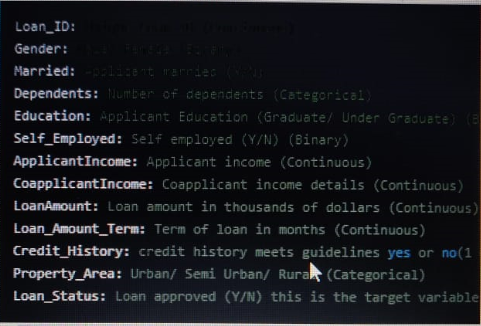
The dataset consists of details of various applications along with their eligibility for loan. The details are:
Problem statements:
Based on this dataset, write a python code to perform the following operations:
Load the dataset from the location of the file provided in “input format” using pandas
Find the columns with missing data
Find the number of missing values in each column with missing data
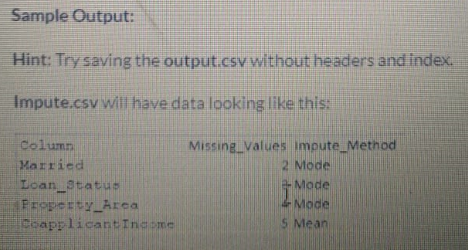
Create the pandas' data frame with the columns: Column, Missing_value, Impute_method, and fill the data as:

Sava the columns in ascending order of missing values and imputing method in a file named Impute.csv the location code/output/Impute.csv
Find the number of rows present in dataset
Find the number of duplicate rows in dataset
Calculate the default correlation between the numeric columns
Find the highest correlation value in dataset (up to 3 decimal places)
Remove all rows with missing data
Split the dataset into Train-Test with the parameter test-size = 0.2 and random_state = 0
Find number of rows in test set
Save the findings in file named output.csv at the location code/output/output.csv
Input format:
Read data from filename BankLoan.csv present at the location /data/training/BankLaon.csv
Output Format:
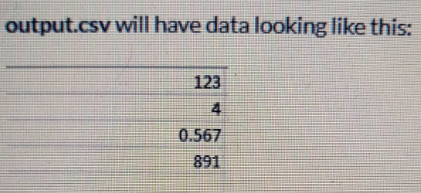
The output file output.csv should contain the findings in the following order:
The first rows contain the number of rows present in the dataset
The second row contains the number of duplicate rows in the dataset
The third row contains the highest correlation value in the dataset(upto 3 decimal places)
The fourth row contains the number of rows in the test set
Question 3:
The dataset has the details of 112 matches along with the date. The matches were between 8 countries and will be held in the country of the home team. The outcome/target variable depicts us either the home team or away wins the match. The features in the dataset are as follows:
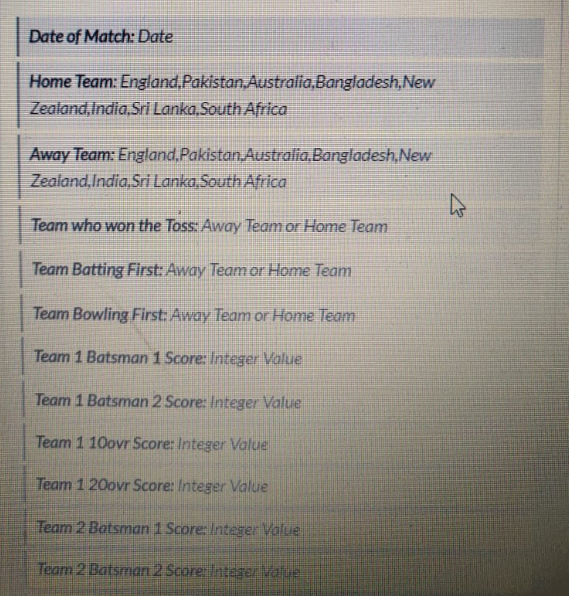
Problem statements:
Based on this dataset, write a python code to perform the following operations:
Load the dataset from the location of the file provided in “input format” using pandas
Find the mean score in 20 overs of the Home team(Team 1 20over score) up to 3 decimal places
Find how many matches were won by Home team
Find the average score of the first batsman (Team 1 Batsman 1 score) when India is playing as Home Team upto 3 decimal places
Find the average score of the first batsman (Team 1 Batsman 1 Score) when india is batting first up to 3 decimal places
Drop the date of match column
Split the target variable(final result) and data(over features)
Convert Home team, away team, Team who was toss, Team batting first and Team batting first into dummy variable
Find the number of columns after the conversion
Using LabelEncoder convert the target variable(Final Result) into binary variable
Split the dataset into Test-Train with the parameter, test-size = 0.3 and random_state = 0
Apply logistic regression over the training set
Find the accuracy of the model
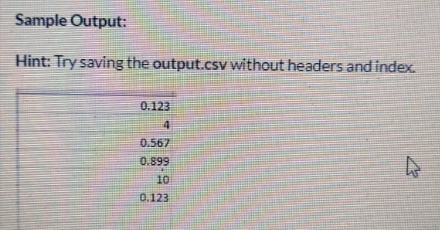
Save the findings in a file name output.csv at the location/code/output/output.csv
Input format:
Read data from a file named CricketMatchDataset.csv present at the location location/data/training/CricketMatchDataset.csv
Output format:
The output file output.csv should have the finding in the following order:
The 1st row contains the mean score in 20 overs of Home Team(Team 1 20ovr Score) upto 3 decimal places
The 2nd row contains the number of matches were won by Home Team
The 3rd row contains the average score of the first batsman (Team 1 Batsman 1 score) when india is playing as Home Team up to 3 decimal places
The 4th row contains the average score of the first batsman (Team 1 Batsman 1 Score) when India is playing as Home Team up to 3 decimal places
The 5th row contains the number of columns after the conversion
The 6th row contain the accuracy of the model
Comment below if you need any help to do this practice exercise or if you have a solution then send it on the comment section.