We shall be covering the role of unsupervised learning algorithms, their applications, and the K-means clustering approach.
Machine learning algorithms can be classified as Supervised and unsupervised learning.
In supervised learning, there will be the data set with input features and the target variable. The aim of the algorithm is to learn the dataset, find the hidden patterns in it and predict the target variable. The target variable can be continuous as in the case of Regression or discrete as in the case of Classification.
Examples of Regression problems include housing price prediction, Stock market prediction, Air humidity, and temperature prediction. Examples of classification problems include Cancer prediction(either benign or malignant), email spam classification, etc.
Other areas of machine learning is unsupervised learning, where we will have the data, but we don’t have any target variable as in the case of supervised learning. So the goal here is to observe the hidden patterns among the data and group them into clusters i.e the data points which have some shared properties will fall into one cluster or one alike group.
One of the basic clustering algorithms is K-means clustering algorithm which we are going to discuss and implement from scratch.
Let’s read the dataset
#Load data
dataset=pd.read_csv('csvfilename.csv')
dataset.describe()
For visualization convenience Selecting 2 and 3 index column value from datasets
X = dataset.iloc[:, [3, 4]].valuesNow X is two matrix of shape (N,2).
The next step is to choose the number of iterations that might guarantee convergence.
m=X.shape[0] #number of training examples
n=X.shape[1] #number of features. Here n=2
n_iter=100
K=5 # number of clusters
Step 1: Initialize the centroids randomly from the data points
Centroids=np.array([]).reshape(n,0)Centroids is a (n x K) dimensional matrix, where each column will be a centroid for one cluster.
for i in range(K):
   rand=rd.randint(0,m-1)
   Centroids=np.c_[Centroids,X[rand]]
Step 2.a: For each training, for example, compute the euclidian distance from the centroid and assign the cluster based on the minimal distance.
#euclidian distance
Output={}
EuclidianDistance=np.array([]).reshape(m,0)
for k in range(K):
tempDist=np.sum((X-Centroids[:,k])**2,axis=1)
EuclidianDistance=np.c_[EuclidianDistance,tempDist]
C=np.argmin(EuclidianDistance,axis=1)+1
Step 2.b: We need to regroup the data points based on the clustered index C and store in the Output dictionary and also compute the mean of separated clusters and assign it as new centroids. Y is a temporary dictionary which stores the solution for one particular iteration.
#compute the clusters
Y={}
for k in range(K):
    Y[k+1]=np.array([]).reshape(2,0)
for i in range(m):
    Y[C[i]]=np.c_[Y[C[i]],X[i]]

for k in range(K):
    Y[k+1]=Y[k+1].T

for k in range(K):
    Centroids[:,k]=np.mean(Y[k+1],axis=0)
Now we need to repeat step 2 till convergence is achieved. In other words, we loop over n_iter and repeat the step 2.a and 2.b as shown:
for i in range(n_iter):
  #step 2.a
  EuclidianDistance=np.array([]).reshape(m,0)
  for k in range(K):
  tempDist=np.sum((X-Centroids[:,k])**2,axis=1)
  EuclidianDistance=np.c_[EuclidianDistance,tempDist]
C=np.argmin(EuclidianDistance,axis=1)+1
#step 2.b
Y={}
for k in range(K):
  Y[k+1]=np.array([]).reshape(2,0)
for i in range(m):
  Y[C[i]]=np.c_[Y[C[i]],X[i]]

for k in range(K):
  Y[k+1]=Y[k+1].T

for k in range(K):
  Centroids[:,k]=np.mean(Y[k+1],axis=0)
Output=Y
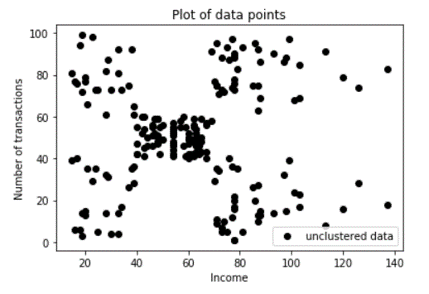
To start with, let’s scatter the original unclustered data first.
#Scatter plot
plt.scatter(X[:,0],X[:,1],c='black',label='unclustered data')
plt.xlabel('Income')
plt.ylabel('Number of transactions')
plt.legend()
plt.title('Plot of data points')
plt.show()
Output:

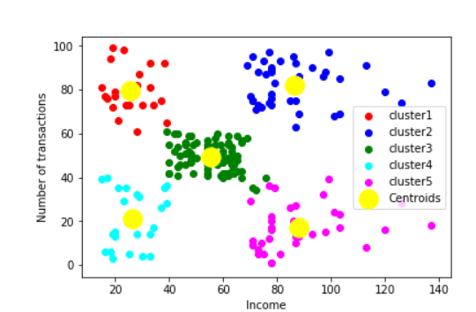
Now let’s plot the clustered data
#plot the cluster data
color=['red','blue','green','cyan','magenta']
labels=['cluster1','cluster2','cluster3','cluster4','cluster5']
for k in range(K):
  plt.scatter(Output[k+1][:,0],Output[k+1][:,1],c=color[k],
label=labels[k ])
plt.scatter(Centroids[0,:],Centroids[1,:],s=300,c='yellow',label='Centroids')
plt.xlabel('Income')
plt.ylabel('Number of transactions')
plt.legend()
plt.show()
Output:

1. Customers with low income but a High number of transactions (For these type may be the company can recommend products with low price) — Red cluster
2. Customers with low income and a low number of transactions (Maybe these type of customers are too busy saving their money) — Cyan Cluster
3. Customers with medium income and a medium number of transactions — Green Cluster
4. Customers with High income and a low number of transactions — Magenta Cluster
5. Customers with High income and a High number of transactions — Blue cluster.
Get your project or assignment completed by Deep learning expert and experienced developers and researchers.
OR
If you have project files, You can send at codersarts@gmail.com directly