Multiscale object Detection in Machine Learning
It is used to reduce the number of anchor boxes. An easy way is to apply uniform sampling on a small portion of pixels from the input image and generate anchor boxes centered on the sampled pixels. In addition, we can generate anchor boxes of varied numbers and sizes on multiple scales.
Notice that smaller objects are more likely to be positioned on the image than larger ones. Here, we will use a simple example: Objects with shapes of 1×11×1, 1×21×2, and 2×22×2 may have 4, 2, and 1 possible position(s) on an image with the shape 2×22×2. Therefore, when using smaller anchor boxes to detect smaller objects, we can sample more regions; when using larger anchor boxes to detect larger objects, we can sample fewer regions.
Now we import all the related libraries and load datasets
#import the libraries and load datasets
%matplotlib inline
import d2l
from mxnet import contrib, image, np, npx

npx.set_np()

img = image.imread('../img/catdog.jpg')
h, w = img.shape[0:2]
h, w
The function display_anchors is defined below. We are going to generate anchor boxes anchors centered on each unit (pixel) on the feature map fmap. Since the coordinates of axes xx and yy in anchor boxes anchors have been divided by the width and height of the feature map fmap, values between 0 and 1 can be used to represent relative positions of anchor boxes in the feature map. Since the midpoints of anchor boxes anchors overlap with all the units on feature map fmap, the relative spatial positions of the midpoints of the anchors on any image must have a uniform distribution. Specifically, when the width and height of the feature map are set to fmap_w and fmap_h respectively, the function will conduct uniform sampling for fmap_h rows and fmap_w columns of pixels and use them as midpoints to generate anchor boxes with size s (we assume that the length of list s is 1) and different aspect ratios (ratios).
 #dispaly image in anchors
 def display_anchors(fmap_w, fmap_h, s):
 d2l.set_figsize((3.5, 2.5))
 # The values from the first two dimensions will not affect the output
 fmap = np.zeros((1, 10, fmap_w, fmap_h))
 anchors = npx.multibox_prior(fmap, sizes=s, ratios=[1, 2, 0.5])
 bbox_scale = np.array((w, h, w, h))
 d2l.show_bboxes(d2l.plt.imshow(img.asnumpy()).axes,
                    anchors[0] * bbox_scale)
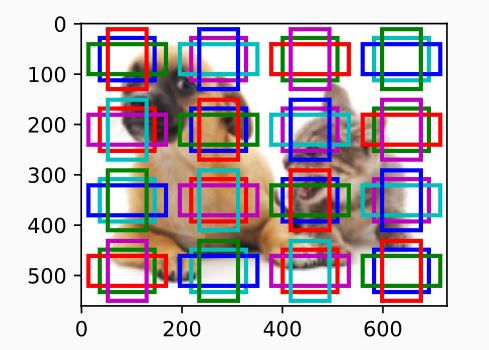
We assume that the size of the anchor boxes is 0.15 and the height and width of the feature map are 4. We can see that the midpoints of anchor boxes from the 4 rows and 4 columns on the image are uniformly distributed.
#call the funtion
display_anchors(fmap_w=4, fmap_h=4, s=[0.15])
Output:
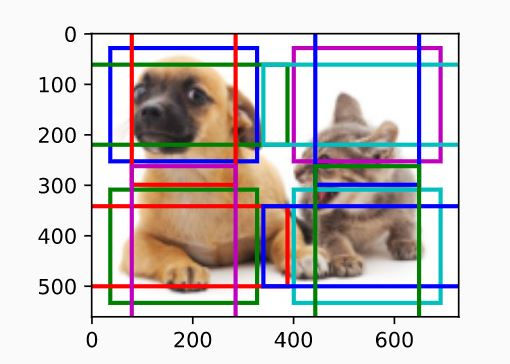
When the size is set to 0.4, overlaps will occur between regions of some anchor boxes.
#display with fmap_w = 2
display_anchors(fmap_w=2, fmap_h=2, s=[0.4])
Output:
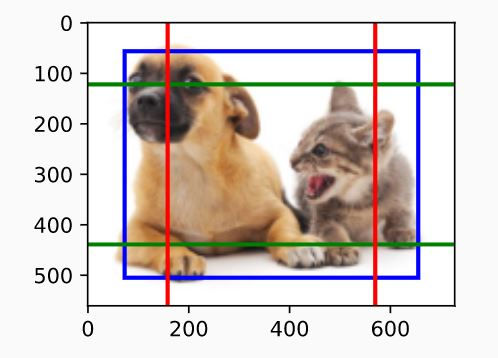
Finally, we are going to reduce the height and width of the feature map by half and increase the anchor box size to 0.8. Now the midpoint of the anchor box is the center of the image.
#reduce the hieght and width
display_anchors(fmap_w=1, fmap_h=1, s=[0.8])
Output:
Get your project or assignment completed by Deep learning expert and experienced developers and researchers.
OR
If you have project files, You can send at codersarts@gmail.com directly