Shark attacks!
You have already worked extensively with the shark attack dataset. This version has a few additional columns:
The area contains a more precise description of where the incident occurred,
Type a broad description of why it happened (importantly, whether the attack was provoked or not),
Injury describes the severity of the injury sustained by the victim (if available),
Species the shark species involved in the attack (insofar it is known),
and finally Size (min) / Size (max) an estimate of the shark's size in cm. The `min` and `max` stem from the fact that the original dataset has a rough description of the attacking shark and often estimates like “between 5 and 7 foot” are provided.
Import Libraries
#import libraries
import pandas as pd
import matplotlib.pyplot as plt
Reading Dataset
#read dataset
df = pd.read_csv("shark-attacks-cleaned.csv")
df
Dataset columns

Removing Nan values
#removing NaN(cleaning dataframe)
data = df.dropna()
data
Dataset summary
1) Describe every column of the dataset: what type of data it is (recall our data type classification!), what values we find in it and how they are roughly distributed. Also, comment on the completeness of the data.
#describe each column of data set
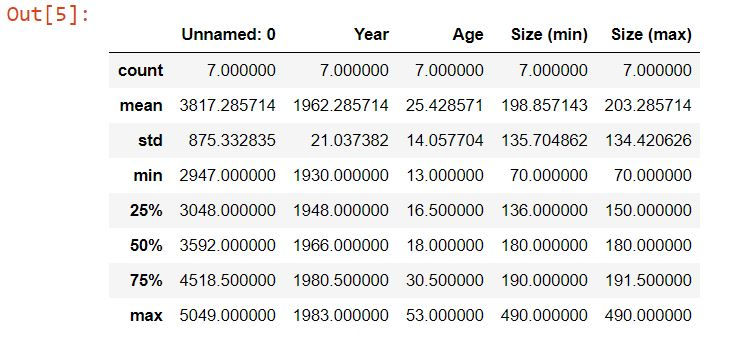
data.describe()
Output
Ans:
Dataset Description
This is a shark attack data set which contains 6300 rows and 14 columns. This is a collection of both Nan and fresh data, here before performing the operation on it first we will remove all Nan or NULL value from the given data set. after describing the dataset we find the different types to statistics calculation automatically by using the describe() function.
This count is a value that is found counting the value of whole datasets column values.
The next one is mean which is the mean of each column values of whole datasets.
And more like standard deviation and max and min values etc.
Here details description about dataset columns:
Dataset Explanation
Dataset columns
['Unnamed: 0', 'Year', 'Month', 'Country', 'Area', 'Type', 'Activity', 'Sex', 'Age', 'Fatal', 'Injury', 'Species', 'Size (min)', 'Size (max)']
year denote the in which is year the attackes are happening and Country, is the name in which it happening.
By using this dataset we calculate the three questions for research and testing our ability to work over the dataset and what we thinking about this data set.
Below we write our own question and give an answer which is the best as per my own knowledge.
In this, we also show it using visualization to make it easy to read the data using a graph that is easy to read by any person easily.
Here we plot the bar graph for all three questions.
Data exploration
2) Come up with three questions about the dataset and attempt to answer them using pandas and matplotlib(and any additional libraries you want to use)
Per question, you should provide at least one plot which helps in exploring the question. Every plot should be accompanied by a description of what is plotted and an interpretation of what it shows with respect to your question.
Examples for good questions are “Do larger sharks cause graver injuries?”, “Which shark species is most dangerous”, or “Do men provoke sharks more than women?”. You can use one of these examples questions, please come up with different questions for the other two.
Your write-up for each question should contain
an explanation of the question,
a discussion on what part of the dataset you are focusing on (and why!),
one or more suitable plots of that part of the dataset (including a description and an interpretation of the plot),
and an attempt at answering your question—if possible, quantitatively.
A few hints:
Select a suitable subset of the data. For example, if your question is related to, say, modern tourism, you should restrict yourself to rows with dates within the last 50 years or so.
Make sure that you select the best-suited plot (among those that were introduced in the lecture and lab) and tune its appearance to make it as readable as possible (in particular with respect to the story you want to tell)
Feel free to use external knowledge to supplement your narrative about the data. Unless it is information that it easily verified, please supply a link to your source (Wikipedia is perfectly fine in this context)
Question 1: (Which shark species is most dangerous?)
Explanation: In this we find the most dangerous shark, here we find it as per Injury which is large numbers, caused by shark attacks
ANS: As per give data the most dangerous shark, whose Injury is "fatal". In these three types of Injury is given, minor, moderate, and fatal so easily we will classify that most dangerous shark by its Injury types. In this we are focusing on the "Fatal" and "Injury" column of dataset.
Ans:
#find most dangerous shark
data.loc[data['Injury'] == 'Fatal']
#Bar Plot
import matplotlib.pyplot as plt
x = data['Injury']
y = data['Age']
data.plot(kind='bar',x='Injury',y='Age')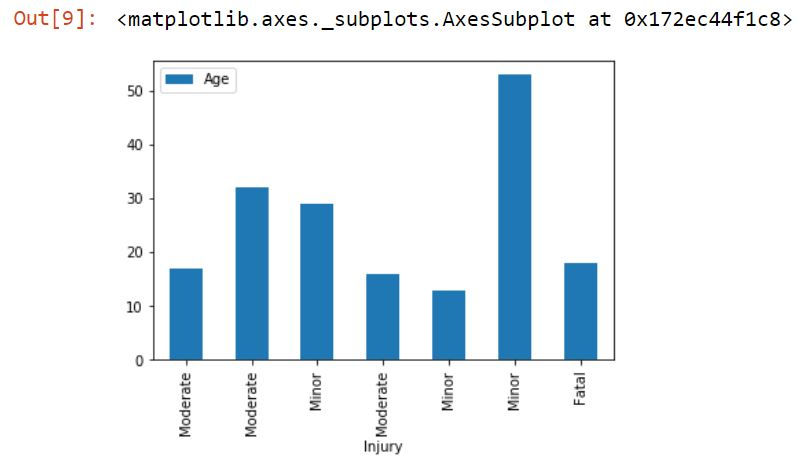
#using groupby
data.groupby('Injury')['Age'].nunique().plot(kind='bar')
plt.show()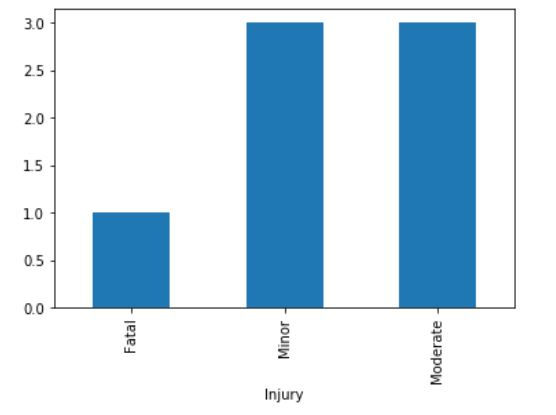
Question 2:(Find all moderate injury species whose `Age` is greater than 17.0)
Explanation: This question is based on the data extraction in which we find the data, in which Injury is moderate and Age is greater than,17.0
Ans: In this question, we will find all the species whose injury is moderate, Here below simple logic to find this. This question is focusing on two data set column first one is Age and second is Injury After finding the data we plot is using bar to better visualize it.
Ans: Find all moderate injury species whose `Age` is greater than 17.0
#
data1 =data.loc[(data['Injury'] == str('Moderate')) & (data['Age'] >= float('17.0'))]
data1
Plot the Graph:
#Bar Plot
import matplotlib.pyplot as plt
x = data1['Injury']
y = data1['Age']
data1.plot(kind='bar',x='Injury',y='Age')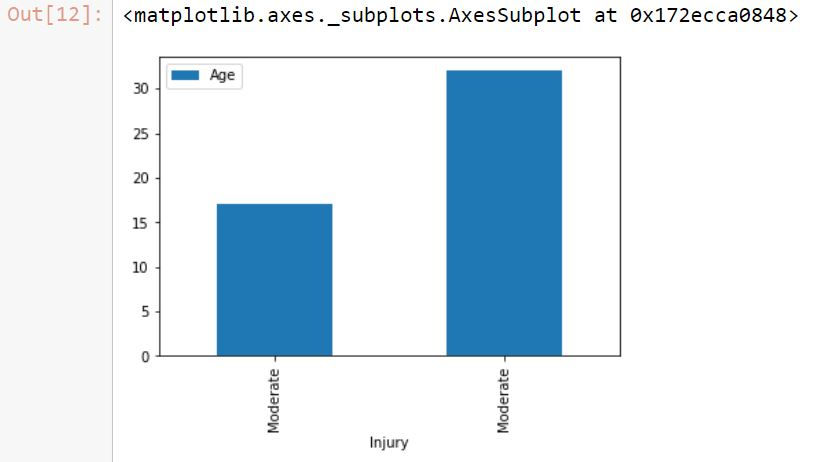
Question 3: (Find max size whose injury is moderate.)
Explanation:
This question based the two dataset columns on is Injury and second is the size of the shark.
Ans:
In this, we find the large size shark whose Injury is moderate. Finally, we plot the graph to show the large size shark data.
#First rename column name of max size to put easily when working on this column
data.rename(columns={'Size (max)':'size_max', 'Size (min)':'size_min'}, inplace=True)
#find the large size shark whose Injury is moderate
data2 =data.loc[(data['Injury'] == str('Moderate'))]
data2#finding max size
max_size = data2['size_max'].max()#Bar Plot
import matplotlib.pyplot as plt
x = data2['Injury']
y = max_size
#data1.plot(kind='bar',x='Injury',y='Size')
plt.bar(x,y)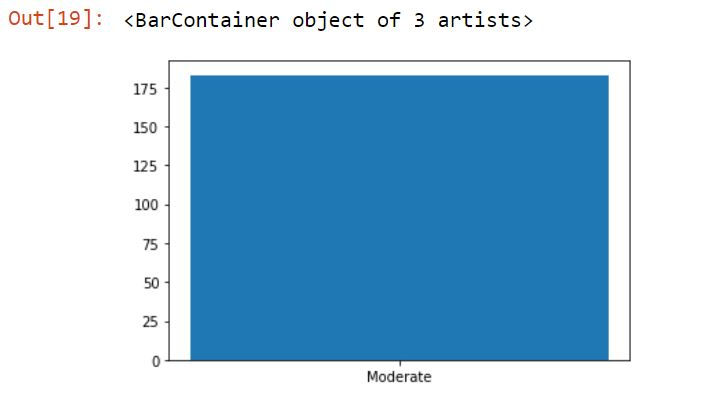
Contact us for this machine learning assignment Solutions by Codersarts Specialist who can help you mentor and guide for such machine learning assignments.
If you have project or assignment files, You can send at contact@codersarts.com directly