Spam Text Dataset - Classification
- Pratibha

- Nov 1, 2021
- 2 min read

Description :
The SMS Spam Collection is a set of SMS tagged messages that have been collected for SMS Spam research. It contains one set of SMS messages in English of 5,572 messages, tagged according being ham (legitimate) or spam.
Recommended Model :
Algorithms to be used: Naïve Bayes, Decision tree, Random forest, SVM, XGBoost, LSTM etc.
Recommended Project :
Spam SMS detection
Dataset link:
Overview of data
Detailed overview of dataset:
- Rows = 5572
- Columns= 2
The files contain one message per line. Each line is composed by two columns: v1 contains the label (ham or spam) and v2 contains the raw text.
This corpus has been collected from free or free for research sources at the Internet:
-> A collection of 425 SMS spam messages was manually extracted from the Grumbletext Web site. This is a UK forum in which cell phone users make public claims about SMS spam messages, most of them without reporting the very spam message received. The identification of the text of spam messages in the claims is a very hard and time-consuming task, and it involved carefully scanning hundreds of web pages. The Grumbletext Web site is: [Web Link]. -> A subset of 3,375 SMS randomly chosen ham messages of the NUS SMS Corpus (NSC), which is a dataset of about 10,000 legitimate messages collected for research at the Department of Computer Science at the National University of Singapore. The messages largely originate from Singaporeans and mostly from students attending the University. These messages were collected from volunteers who were made aware that their contributions were going to be made publicly available. The NUS SMS Corpus is avalaible at: [Web Link]. -> A list of 450 SMS ham messages collected from Caroline Tag's PhD Thesis available at [Web Link]. -> Finally, we have incorporated the SMS Spam Corpus v.0.1 Big. It has 1,002 SMS ham messages and 322 spam messages and it is public available at: [Web Link].
EDA [CODE]
import pandas as pd
# load data data = pd.read_csv('spam.csv')
data.head()
# check details of the dataframe
data.info()
# check the no.of missing values in each column
data.isna().sum()
# statistical information about the dataset
data.describe()
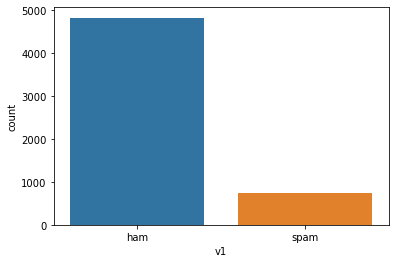
# data distribution

import seaborn as sns
import matplotlib.pyplot as plt

sns.countplot(x='v1', data=data)
plt.show()

#Adding new feature 'message_length'
data['message_length'] = data['v2'].apply(lambda x: len(x.split(" ")))
Other datasets for classification:
If you need implementation for any of the topics mentioned above or assignment help on any of its variants, feel free to contact us


Comments